This page features various data visualizations created by Drew Mery in Tableau. The dataset utilized for the Word Count Overview was compiled by Jeffrey Kranz of Overview Bible. You can learn how he compiled the data and request the data from him here.
As a Data Analyst, I (Drew) love visualizing data in various ways in order to gain interesting and valuable insights that would otherwise be difficult to discern. The purpose of this page is to help fellow Bible-lovers better understand the contours and make-up of the Bible – Testament, genre, authors, and books.
Word Count Overview
The counts in this dataset are based on the original Greek (NA 27) and Hebrew (The Lexham Hebrew Bible), not an English translation.
View interactive version here.

The Old Testament accounts for over 70% of the Bible! Of that roughly 70%, about 35% is of the history genre, 26% law, 25% prophecy, and 13% poetry/wisdom. Keep in mind that these are rough genre divisions. Obviously, there is overlap of these genres in various books of the Bible. Note how the history genre has the most word count for both Old and New Testaments. Something tells me, and biblical theology confirms this, that these histories are significant for understanding the progress of the Bible’s story of redemption. This next visual is kind of a morph between the 100% stacked bar chart and the column chart above. It takes each Testament and calculates the % of total word count across genre.

Speaking of genre, let’s take a look at the word count of each book of the Bible under their respective genre. The first image is of all OT books and the second image is of all NT books.


It’s important to keep in mind that a higher word count does not equate to higher importance. While all books of the Bible are important, as they are all God’s word to us, nonetheless, some books carry more weight when it comes to doctrinal and theological matters. We can see here that history contains the most words, which is what we would expect. There are a lot of important redemptive historical events in the Bible, all of which helps us to make sense of the birth, life, death, and exaltation of Jesus Christ, of which the epistles (or letters) explain the doctrinal and theological significance. Keep in mind too, that law and prophecy have significant historical characteristics to them. Even though Genesis falls under law, due to the first five books of the Bible being referred to as the Torah (Law), it is primarily historical in nature.
Here’s another way to visualize the above two visuals. In this data viz, we see more clearly the distribution of books based on their word count and grouped by genre. The only downside to this approach, compared to the previous two visuals, is you can’t add the book labels to the data points because then it would just clutter up the visual. I suppose you could select a few book labels to display, but even that would be somewhat distracting, in my opinion.

Moving on. The idea behind this data viz is to help us see how three of the most popular biblical authors – Moses, Paul, and John – have contributed to the Bible in comparison to other biblical authors.

As we would probably expect, they make it in the top 10 based on word count. Perhaps you notice something from this visual that may be a bit of a surprise to people. I’ll provide a different visual to make this stand out more clearly. Does this visual surprise you?

Let’s drill down into this visual by looking at the word counts of the individual books associated with these NT authors.
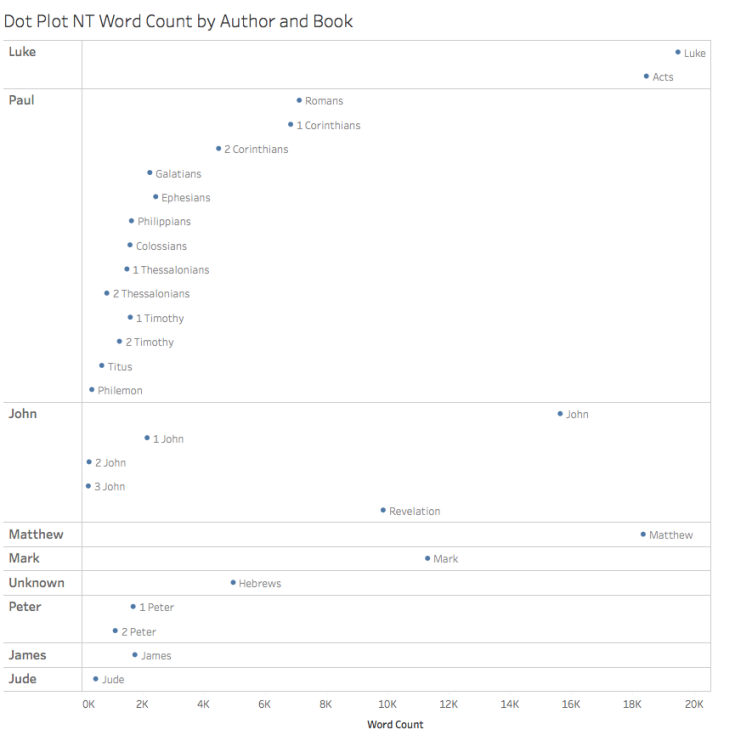
From this visual you can see more clearly the point I made earlier about Paul contributing the most books to the NT but not necessarily the most words.
